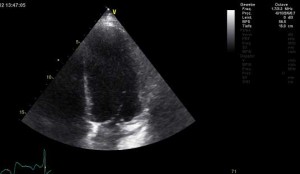
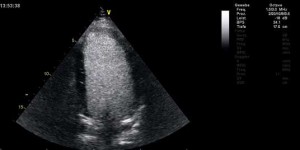
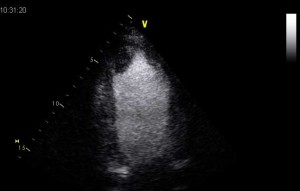
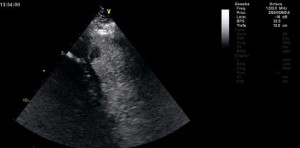
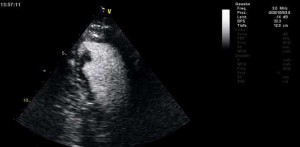
With the software version (GA 200956-06) from 2011 contrast imaging is at least as good as with the Vivid 7 platform. After choosing “LV-contrast” and the M5S-probe several frequencies are available. In the right upper corner of the screen the choosen frequency is display. In the next row five values are shown: first the gain, then compression, filter, dynamic and finally DDP. We start with a mechanical index of 0.10 and adjust from 0.06 to 0.16 according to image quality and issue. We prefer “grey table 13” or “gold”.
For left ventricular opacification (LVO), measuring of volumes and ejection fraction, we use the frequencies 1.5/3.0 or 2.0.
As default values between 20 (lowest possible value) and 16 are helpful for compression and between 2 and 10 for filtering.
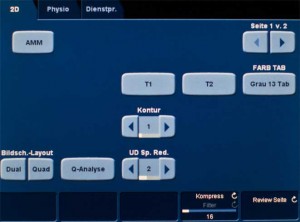
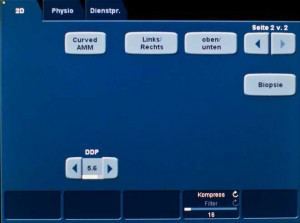
We start with 1.5/3.0 MHz, compression 16, filter 2. If we want to enhance contrast, we set compression to 20 and filter to 10. We don`t change the value for dynamic (maximum = 10). As default, we use a DDP of 5.6, contour of 1 and UD speckle reduce of 2.
For each examination we advise the use of the 2.0MHz frequency. The suppression of intense back scatters is much better than with 1.5/3.0 MHz. Even visualization of perfusion signals seems to be possible. (see below)
.
| After choosing “LV contrast” the first screen gives different possibilities for image optimization. We prefer “grey table 13” or “gold”. The most important button is displayed in the last row. Activated is “compression 16”, filter 2 is greyed out. | On the next sreen the button for DDP is displayed. Again compression and filter can be changed by the button in the last row. |
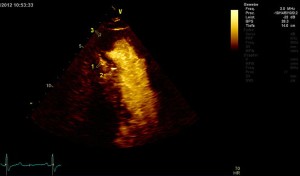
The next example shows images from a patient with an apical thrombus after a myocardial infarction of unknown age. The indication for an echocardiography was given after a routine ECG has shown a reduction of R-waves.
The probe frequency has been changed from 1.5/3.0 MHz to 2.0 MHz, mechanical index has been reduced to 0.07.
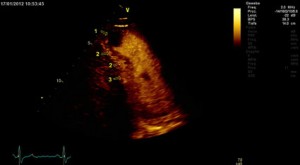
| 2 chamber view, frequency 2 MHz, mechanical index 0.07, compression 16, filter 2, apical thrombus (1) as a contrast free area. The apical inferior wall segment (2) shows a darker “staining” than the basal inferior wall (3) as a sign of a perfusion defect apical and a normal perfusion basal. A “flash” is not yet available, but would facilitate the recognition of a perfusion defect. | |
| The perfusion defect (1) may be easier to recognize with a compression set to 14 and a filter of 5, although in principle compression of 16 and filter of 2 (see above) is the better choice. |
The freezed frames above are taken from the following video loops:
video on the left side with compression 16, filter 2, video in the right side with compression 14, filter 2. The settings for the left video are the better choice.
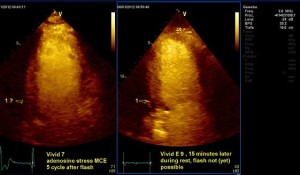
In the next patient we have performed a myocardial perfusion imaging (MCE) during vasodilatator stress with adenosine, using a Vivid 7 platform. During rest additional images are recorded with the Vivid E9 platform. For both a pump with an infusion rate of 0.8 ml/min SonoVue is used.
| On the left side a freezed frame from the fifth cycle after flash during adenosine vasodilatator stress, recorded with a Vivid 7 platform and a mechanical index of 0.08. A small pericardial effusion can not be visualized in this 3 chamber view ( 1 ?). On the right side at rest without flash but with a mechanical index of 0.05 and the Vivid E9 platform a small pericardial effusion can be delineated in the area of the basal posterior wall segment. Compression 16, filter 2. | |
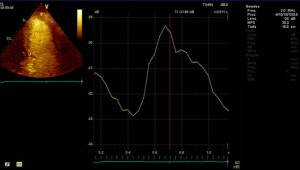
| A sample volume (ROI) for quantification of perfusion is set in the area of the basal posterior wall segment. The typical pattern of a perfusion signal with a systolic decreasing signal intensity and a diastolic rising intensity is displayed. |
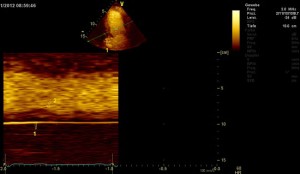
| An “anatomical m-mode is used to display a cross-section of the basal posterior wall segment, shown in the lower part of the image. With a mechanical index of 0.05 the signal of the myocardium ( 2 ) can be differentiated from the contrast free area of the pericardial effusion ( 1 ). With a mechanical index of 0.05 and without using contrast no signal can be obtained from the wall segment. |
| The vidio loop belonging to the freezed frames. Better resolution and delineation in the area of the basal posterior wall segment with the Vivid E 9 platform, 2MHz, MI=0.05 |

